


 337 / 408

Chapter 4
– Sewage Systems and Water Treatment –
3.29%
26.86%
48.60%
0.24%
0.08%
20.95%
أم الهيمان
Um Al-Hayman
الرقة
Al Rigga
الجهراء
Al Jahra
الصليبية
Al Sulabyia
صباح الأحمد والخيران
Sabah Al Ahmed & Al khiran
الوفرة
Al wafra
كبد
kabd
لعــــام
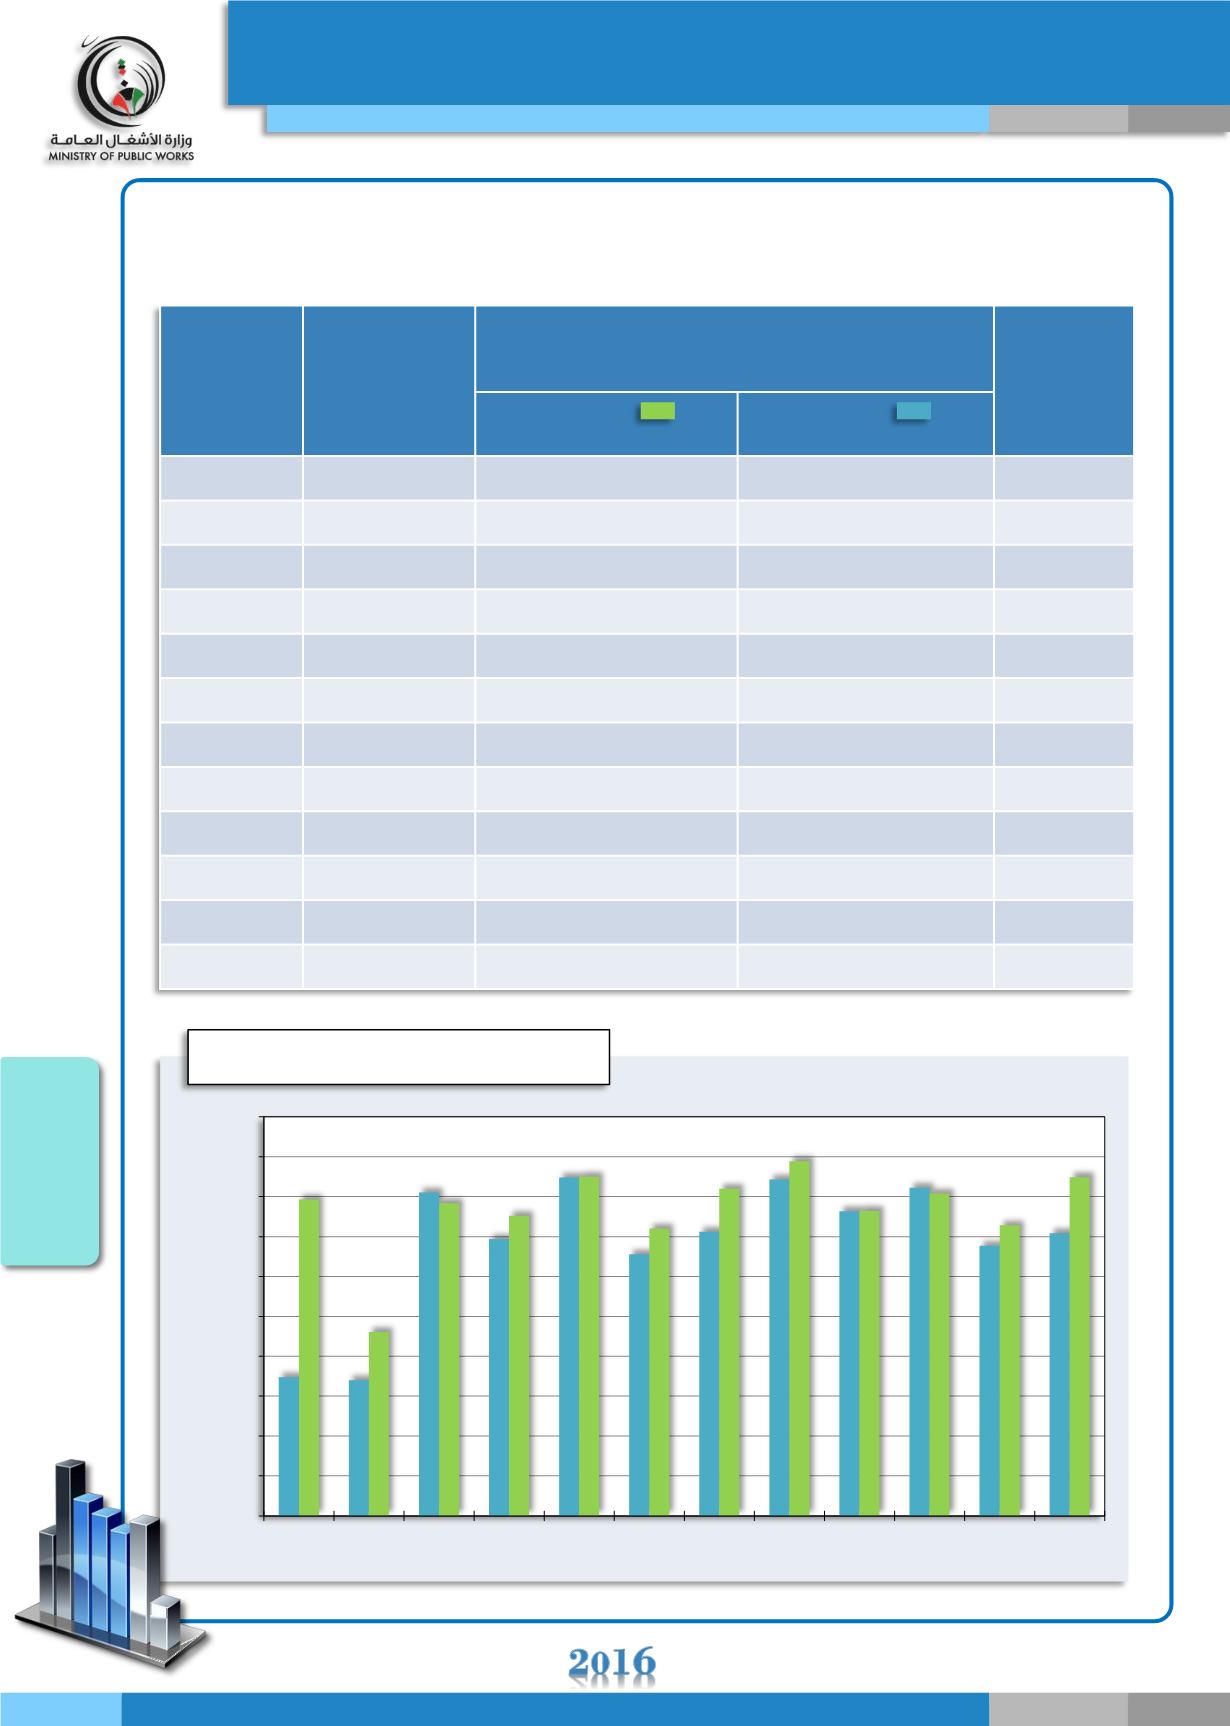
بــيـــان تـفـصـيـــلـي لإجــمــالـــي تدفـــقــــات المـــاء الممـــلــــح شــهـــريــــا
2014
و عــــام
2015
A detailed statement about the total flow of the salted water ‟brine” per month in 2014 - 2015
الشهر
كمية تدفقات الماء المملح
)³متر(
The amount of the flow of the salted water ‟brine” (m³)
النسبة المئوية للزيادة
% of increase
Month
لعام
For year 2014
لعام
For year 2015
يناير
1,573,811
1,796,564
14.2 %
January
فبراير
1,570,185
1,630,594
3.8 %
February
مارس
1,805,167
1,791,996
- 0.7 %
March
أبريل
1,746,854
1,776,050
1.7 %
April
مايو
1,823,866
1,825,045
0.1 %
May
يونيو
1,727,779
1,760,101
1.9 %
June
يوليو
1,756,045
1,809,972
3.1 %
July
أغسطس
1,821,513
1,844,613
1.3 %
August
سبتمبر
1,781,936
1,782,385
0.03 %
September
أكتوبر
1,811,309
1,803,982
- 0.4 %
October
نوفمبر
1,738,410
1,764,135
1.5 %
November
ديسمبر
1,754,226
1,824,701
4 %
December
1,400,000
1,450,000
1,500,000
1,550,000
1,600,000
1,650,000
1,700,000
1,750,000
1,800,000
1,850,000
1,900,000
يناير
فبراير
مارس
ابريل
مايو
يونيو
يوليو
أغسطس
سبتمبر
أكتوبر
نوفمبر
ديسمبر
كمية تدفقات الماء المملح
)³متر(
The amount of the flow of the salted water ‟brine” )m³)
January
December
November
October
September
August
July
June
May
April
March
February
337
Statistical Year Book
الدليـــل الإحصــائــي الســـنوي