


 315 / 404

الباب الرابع
–
شبكات الصرف الصحي و المياه المعالجة
Chapter 4 - Sewage systems and water treatment
ا لعام
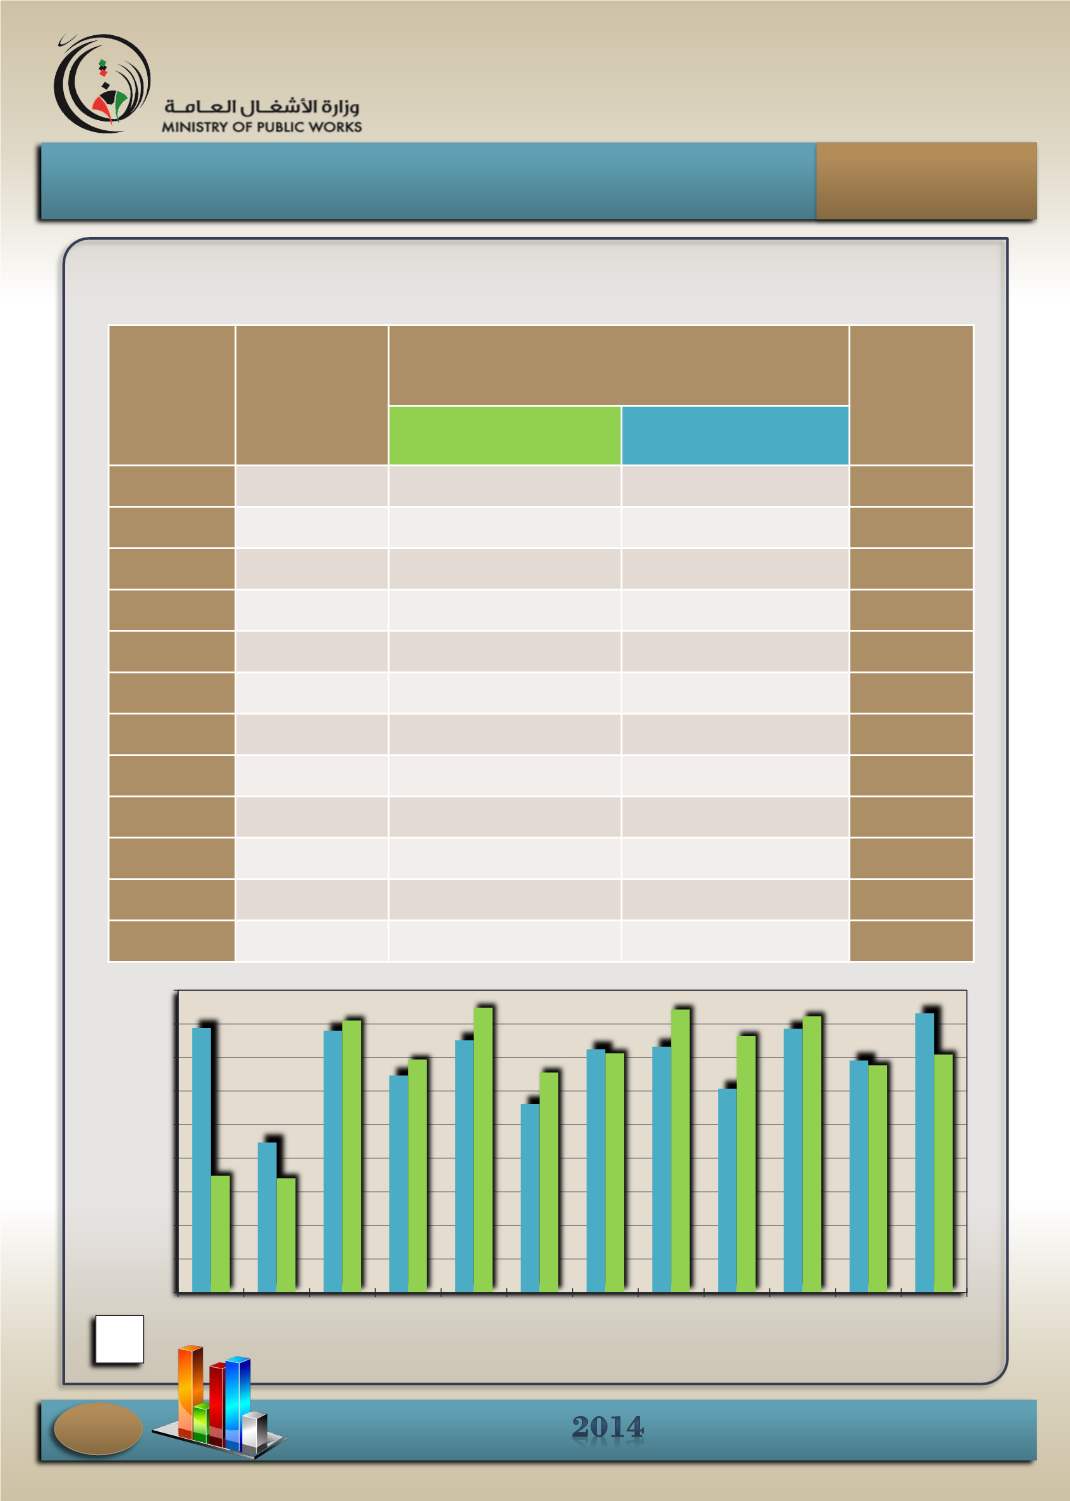
بيان تفصيلي لإجمالي تدفقات الماء المملح شهريا
2013
و عام
2014
A detailed statement about the total flow of the salted water ‟brine” per month in 2013 - 2014
1,400,000
1,450,000
1,500,000
1,550,000
1,600,000
1,650,000
1,700,000
1,750,000
1,800,000
1,850,000
يناير
فبراير
مارس
ابريل
مايو
يونيو
يوليو
أغسطس
سبتمبر
أكتوبر
نوفمبر
ديسمبر
³متر
m³
الشهر
كمية تدفقات
الماء المملح
)³متر(
The amount of the flow of the salted water ‟brine”
(m³)
النسبة المئوية للزيادة
% of increase
Month
لعام
For year 2013
لعام
For year 2014
يناير
1,793,988
1,573,811
- 13.9 %
January
فبراير
1,623,581
1,570,185
- 3.4 %
February
مارس
1,790,031
1,805,167
0.8 %
March
أبريل
1,723,152
1,746,854
1.4 %
April
مايو
1,775,443
1,823,866
2.7 %
May
يونيو
1,680,677
1,727,779
2.7 %
June
يوليو
1,762,150
1,756,045
- 0.3 %
July
أغسطس
1,766,016
1,821,513
3.1 %
August
سبتمبر
1,703,461
1,781,936
4.4 %
September
أكتوبر
1,792,632
1,811,309
1.03 %
October
نوفمبر
1,745,592
1,738,410
- 0.4 %
November
ديسمبر
1,815,847
1,754,226
- 3.5 %
December
January
December
November
October
September
August
July
June
May
April
March
February
الدليل الإحصائي السنوي
Statistical Year Book
315